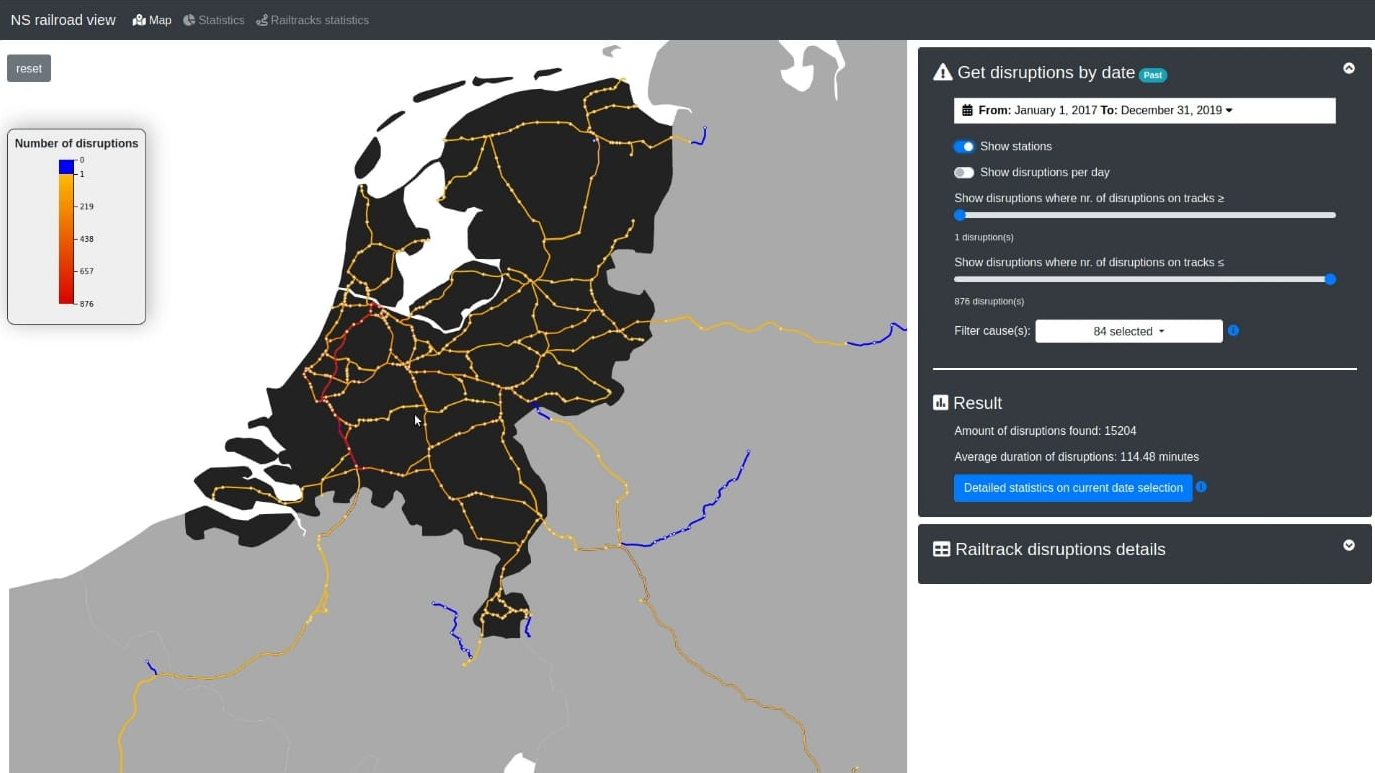
Visualisation of Dutch Railways
In this project, the aim was to visualize disruptions on the dutch railways. This visualization is done via D3.js connected to the API of the NS. The application also contains a statistics tab with more in-depth information about each track.
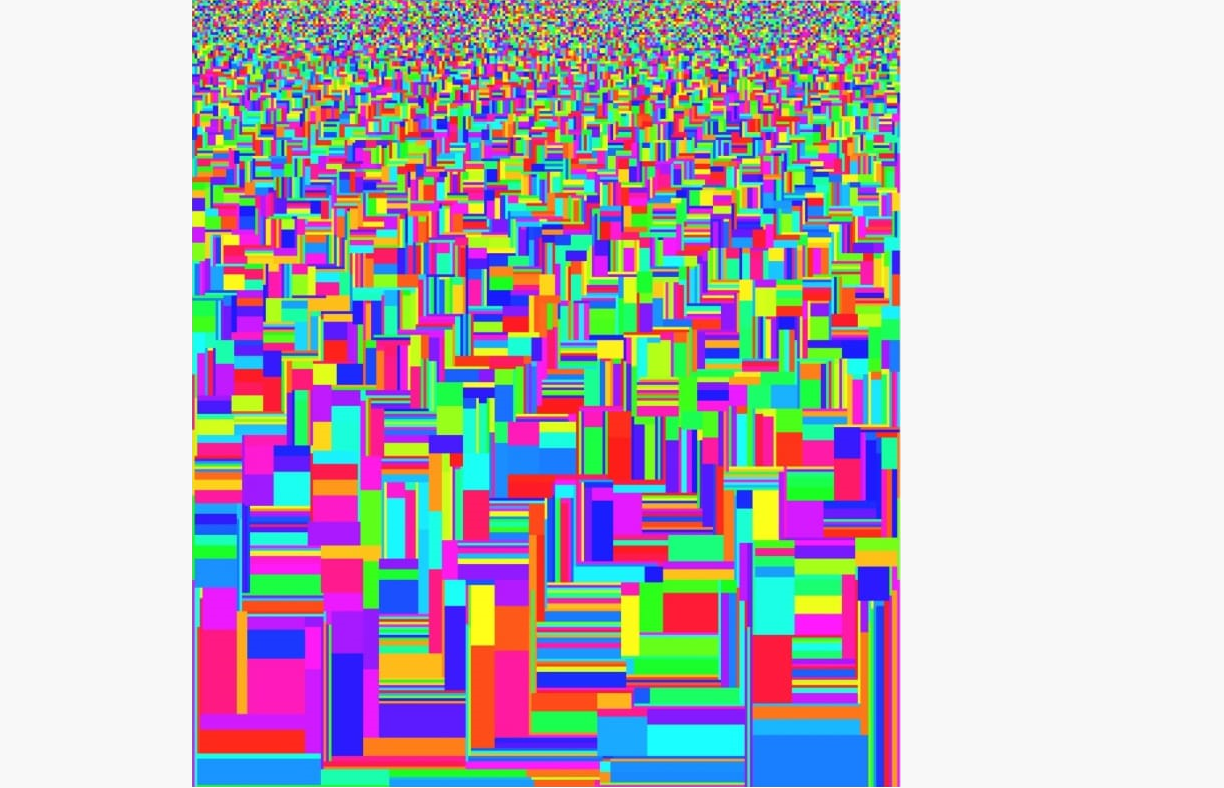
Visualisation of source code
This project aims to enhance the ability to improve your source code by visually inspecting it in one overview. This application can show code lines that are too long, unfinished loops, highlight keywords and duplicated code, statistics about files, uncalled functions, and more. Demo: http://src-explorer.glitch.me/

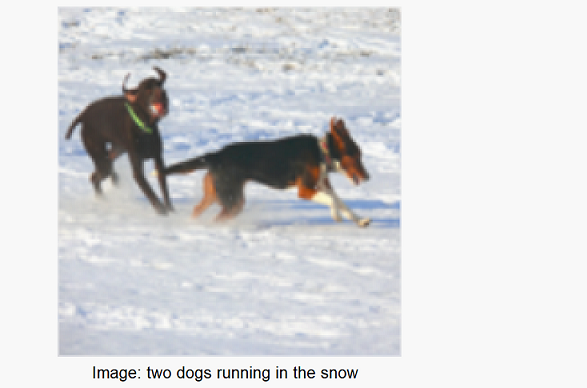
Image captioning using a LTSM model
The goal of this project was to generate automated captions under images. I achieved this by implementing an LTSM model using the Flickr8k dataset.
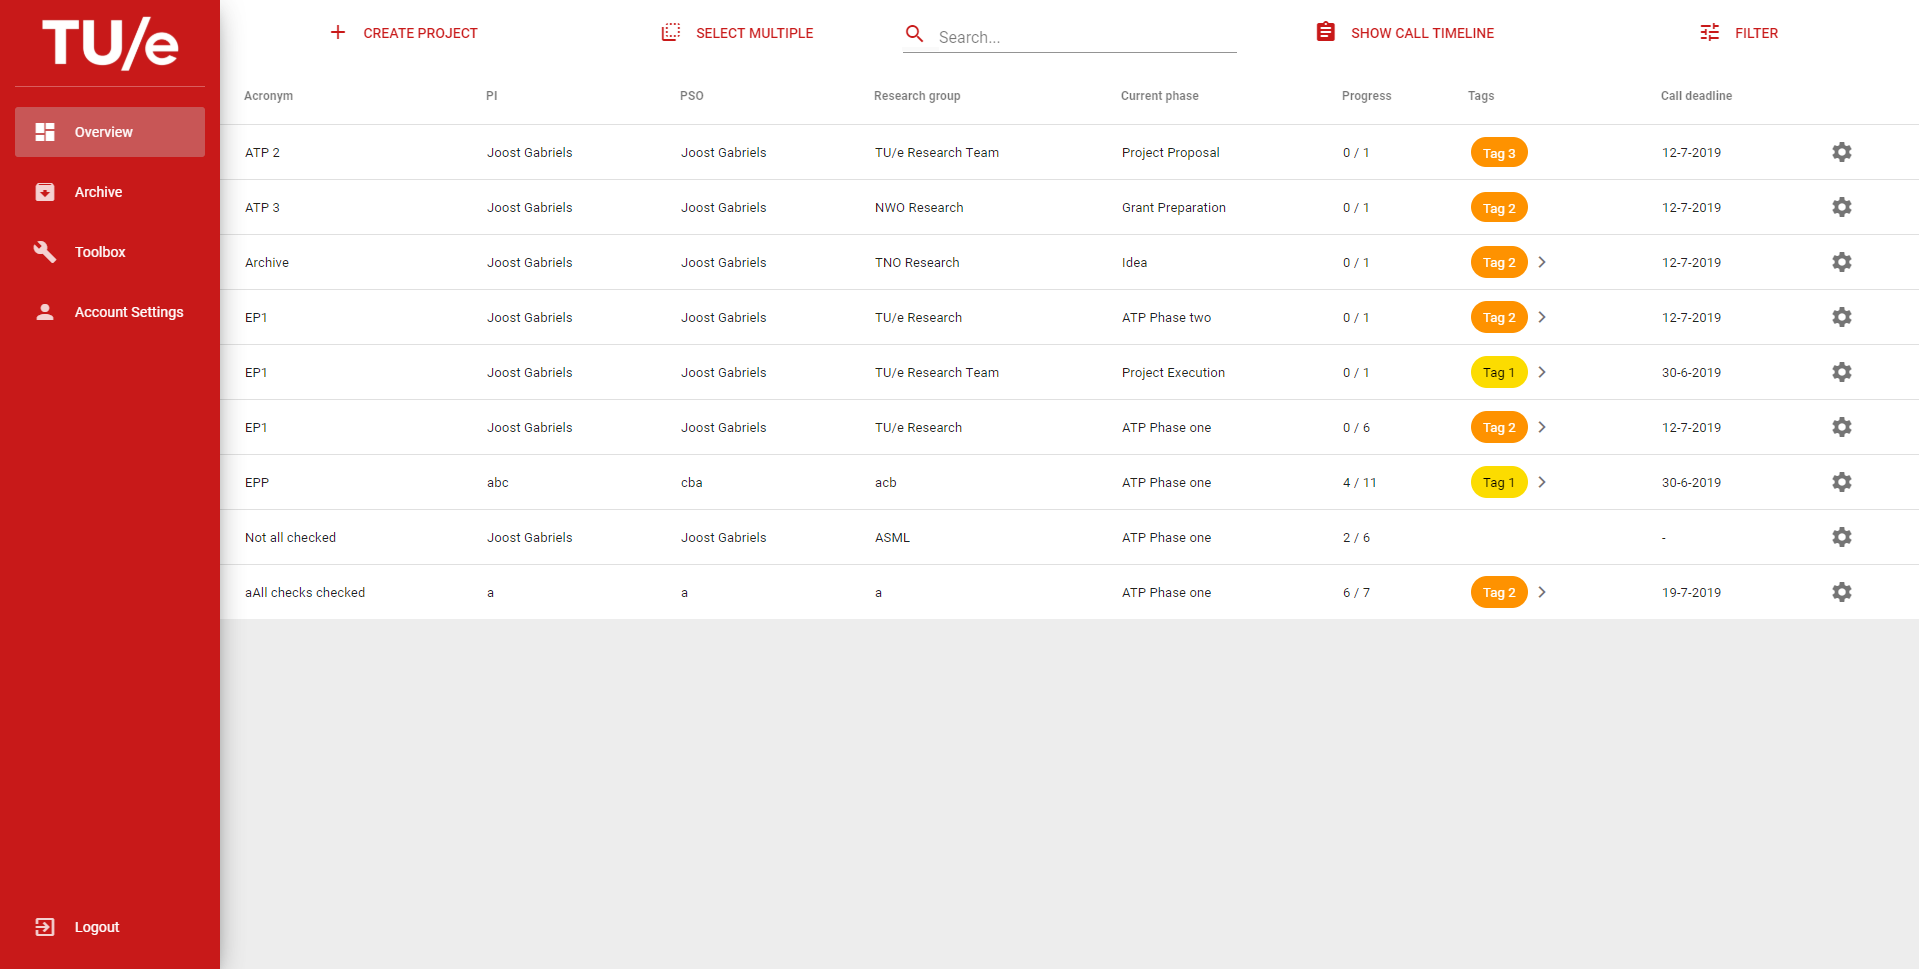
Project manager for the TU/e
This is my bachelor’s end project, where we had to create a project manager for research funding for researchers at the TU/e.
Optimal packing algorithm
In this project, we had to implement a set of algorithms to observe which algorithm had the least amount of lost space, given different sets of rectangles.